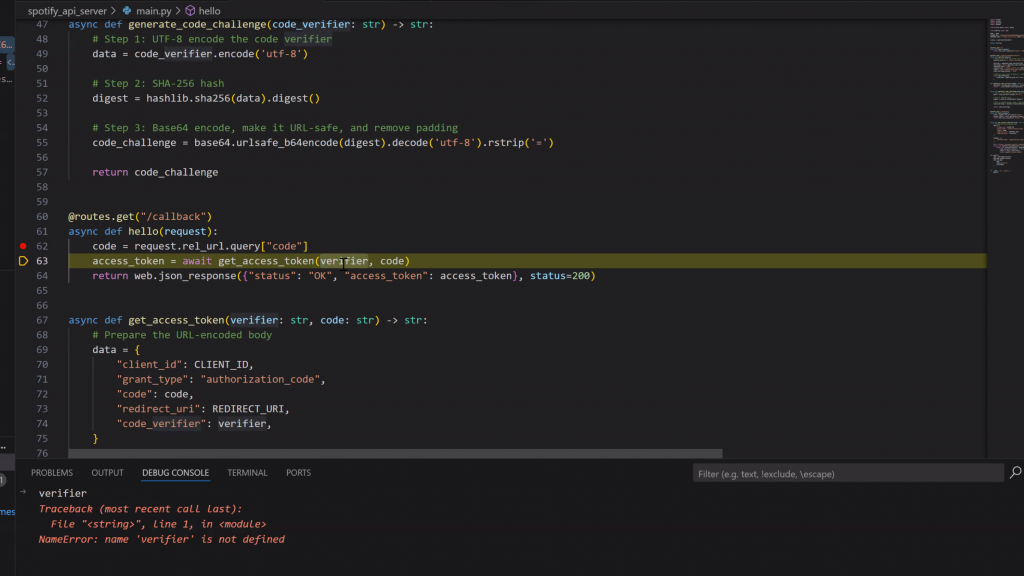
I originally started with the goal of scraping Spotify to stream the trending songs of the day. To do this properly, I went straight to the Spotify for Developers page and began experimenting with their API. I played around with redirect URIs and OAuth flows to understand how the authentication process works and to get access tokens for streaming data.
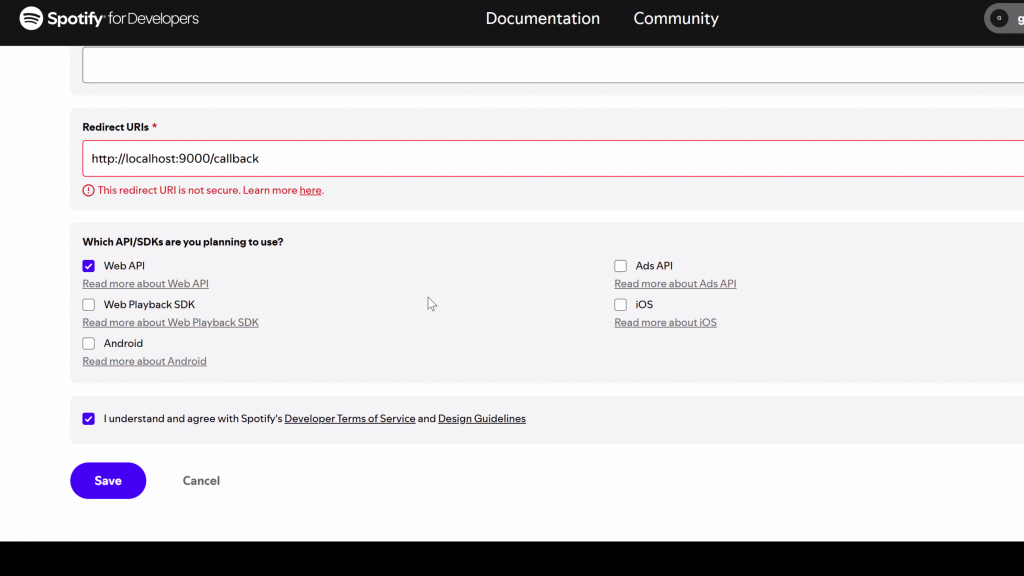
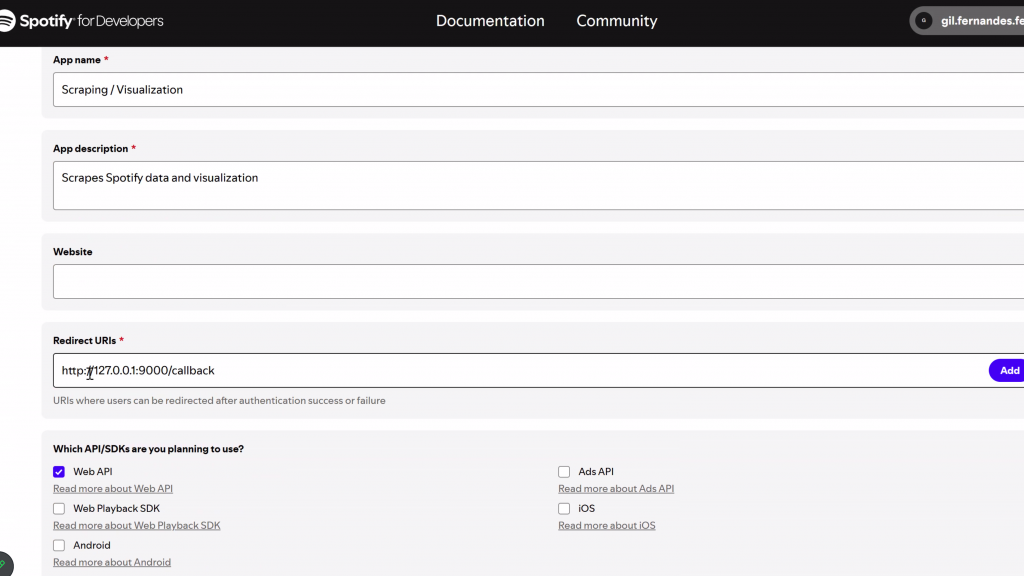
I carefully went through the documentation, which was in another language, and tried to understand it from a Python perspective since my application was going to be fully in Python. I used this as a base to start working.

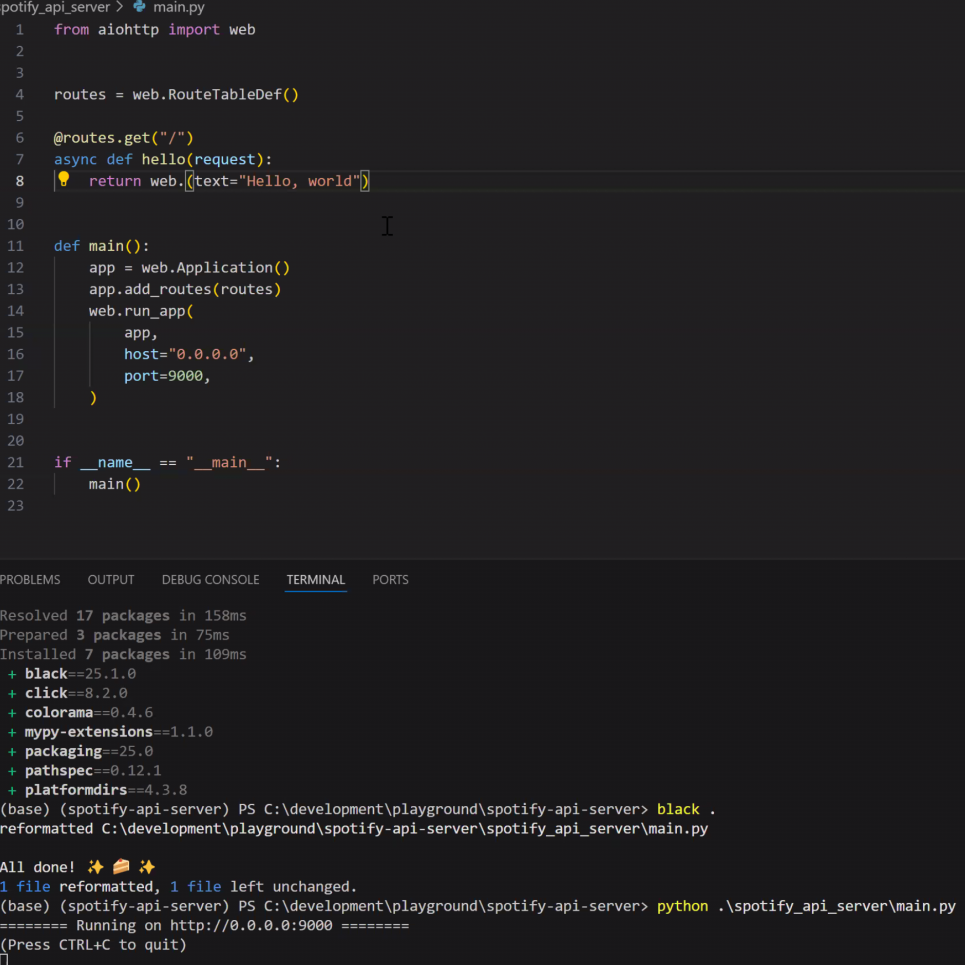
I found myself going in circles while trying to understand the Spotify API, as it was beyond my current scope and expertise. Despite experimenting with different methods and setting up my own environment, I ultimately struggled to make meaningful progress with the API.

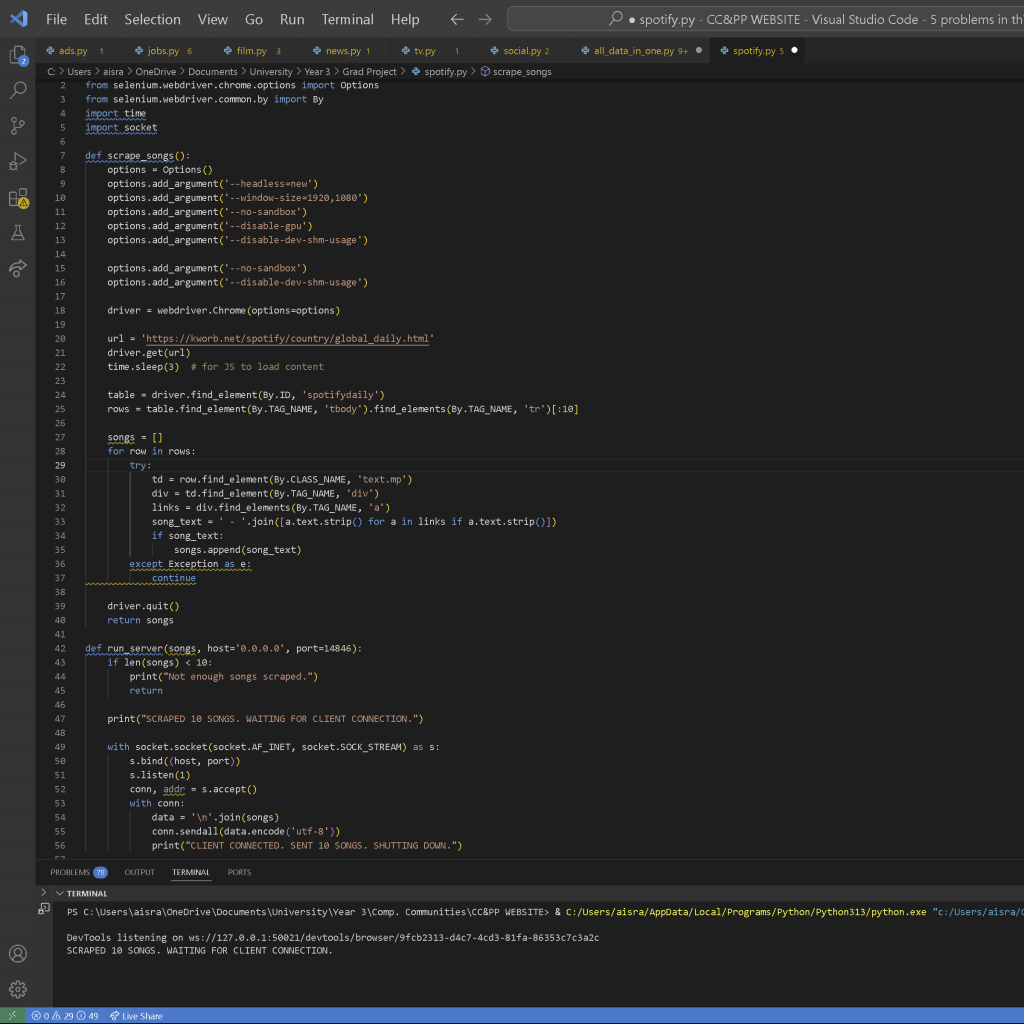
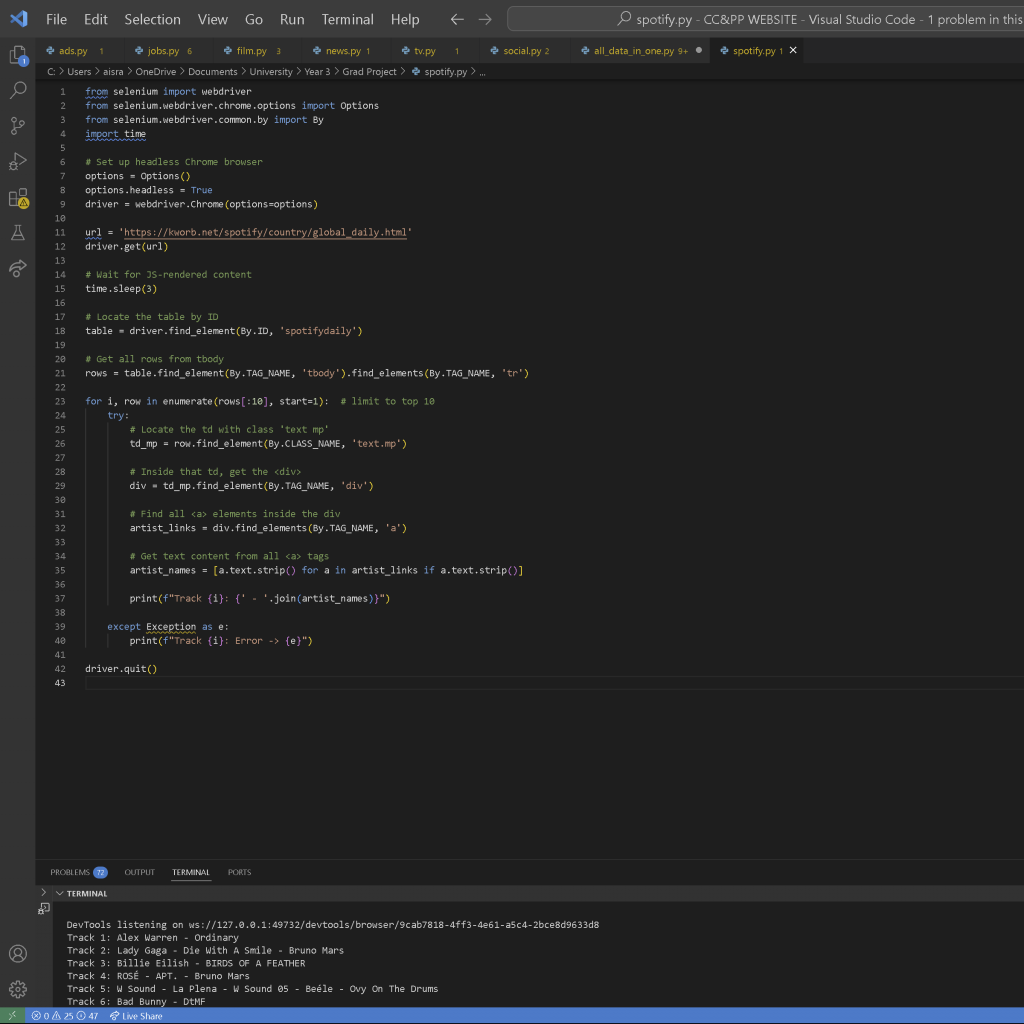
I then switched to this site, which provided daily charts for the top songs on Spotify. With an incredibly simple website structure, I found it very easy to scrape the data I needed. The number of attempts required to successfully extract the information was minimal. I refined it a little bit and visualised it easily. I decided to leave the animation portion to when I combined the data files as I was getting short on time by this point.
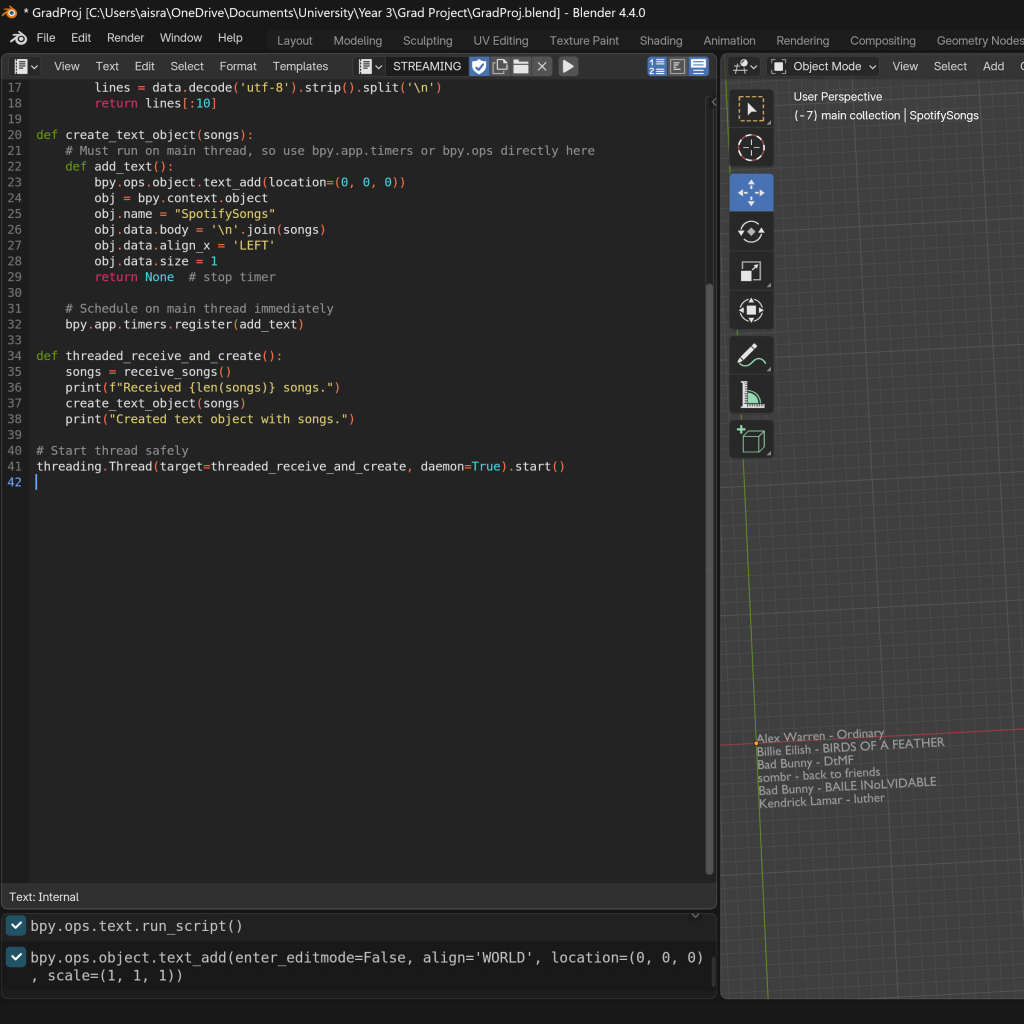
Due to the issues mentioned earlier—such as unpredictability, high computational demands, and potential data stream synchronization problems with the animation scene—I decided not to implement looping or constant updating functionality from the outset. Instead, I scraped a minimal number of posts and used this data during the stage where I combined data, animation, and visualization. Once Blender connected, I sent the data to it and then shut down the server.