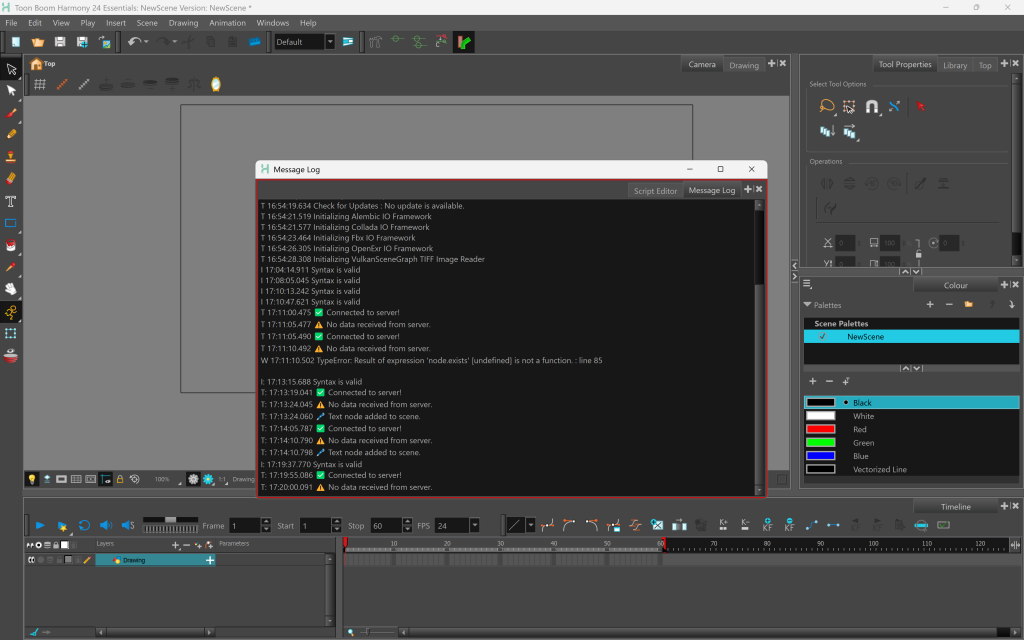
Since news scraping was one of the first tasks I started, I needed to carefully consider both where the data would come from and how it would be visualized. My initial attempt was to script within Toon Boom Harmony, the software I was using for the animation. I thought it would be efficient to handle everything within a single platform. However, there was another issue: I had a clear vision of a 2D animated project, but Blender only supports scripting in 3D environments.
After some attempts to get a working script in Toon Boom Harmony, I ran into difficulties. The UI was more complex than I had anticipated, and I struggled to figure it out.
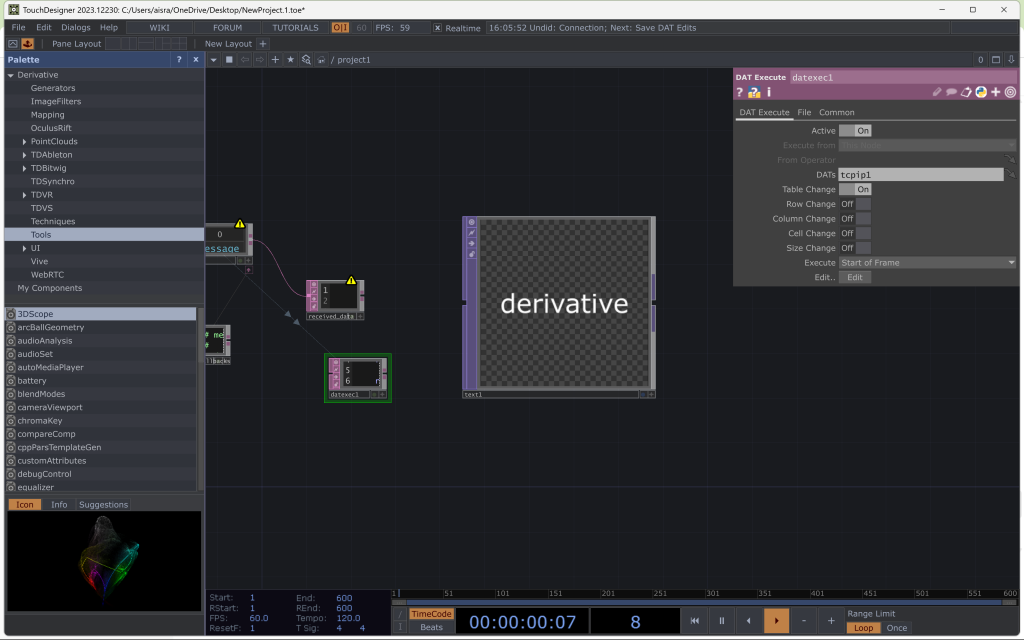
I then tried Touch Designer but the learning curve was much too steep and I spent too much time trying to figure it out.
I moved on to P5.JS and Processing, but these took a long time to lod my video and data in, which would not be viable given what I wanted my project to accomplish.
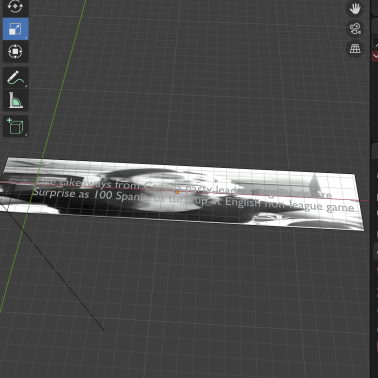
With the project on a tight deadline, I didn’t want to invest time into learning a new software, so I decided to pivot to something I was more comfortable with – Blender, mainly due to my familiarity with it, and I wanted to import 2D animation into the 3D environment, so checked by adding a video file and layering the data on top, which seemed to work.
I had previously used Blender’s scripting functionality in an earlier project, so it made sense to build on that experience. With the help of online tutorials—and quite a bit of trial and error—I managed to install the necessary packages and set up the environment for data scraping. This allowed the collected data to be read and processed using Blender’s built-in Python scripting module. A particularly helpful YouTube tutorial I followed for this setup was this one.
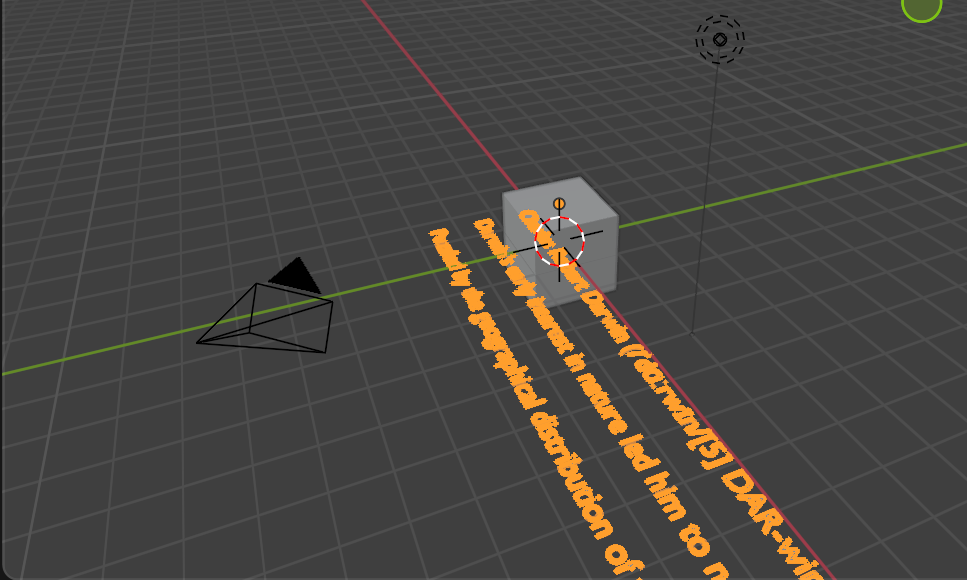
At the same time, I wanted to ensure that the final animation maintained a 2D aesthetic. To test this, I imported an MP4 file into the scene, placed it beneath some dummy-generated data, and positioned the camera directly above the plane. This successfully created the flat, 2D look I was aiming for. Based on this result, I decided to place all data visualizations on a single flat plane, with animations imported onto the same plane underneath, and keep the overhead camera setup to preserve the 2D effect.
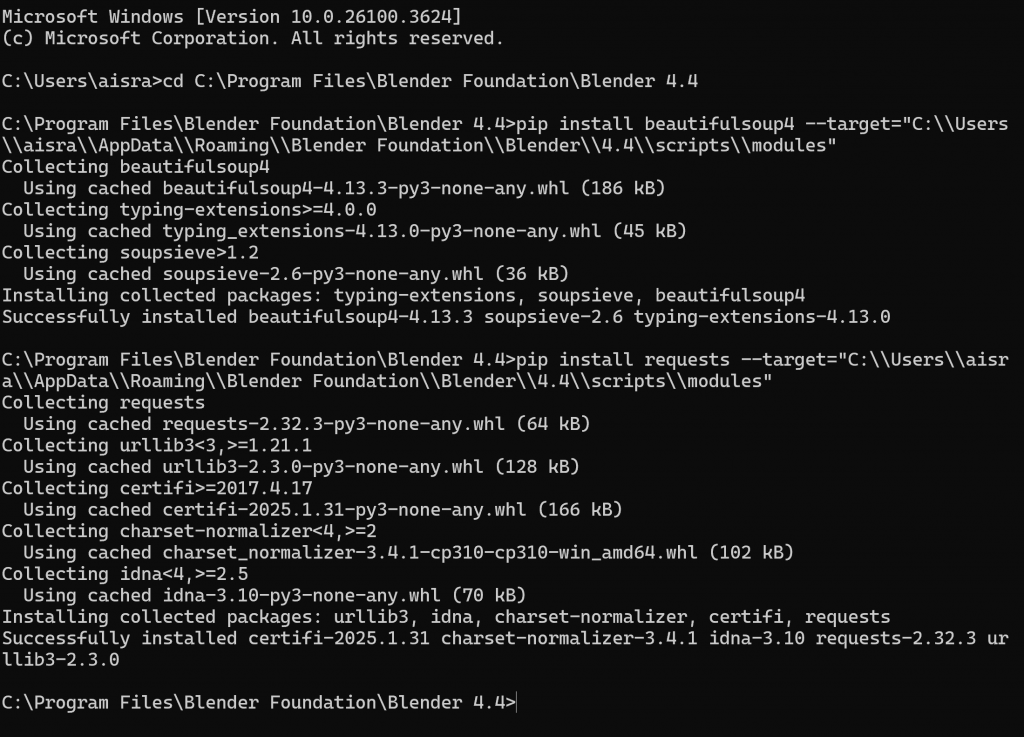
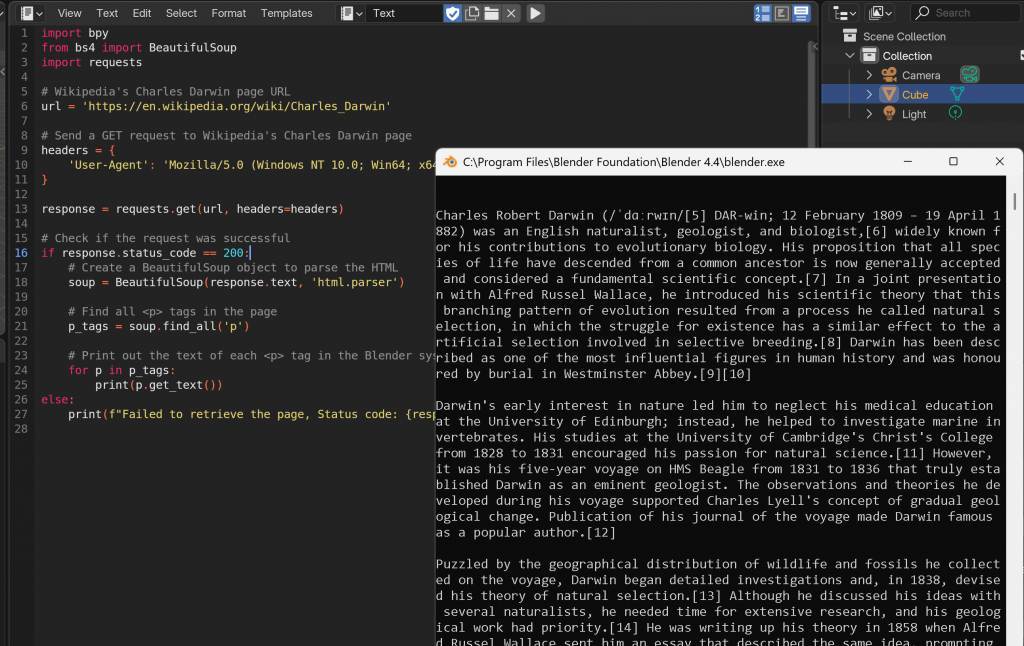
I then did some scraping tests with more static pages where the HTML would be easier to scrape, and the content was not dynamically loaded, just to check if Blender would be able to read the downloaded libraries, like BeautifulSoup and Selenium. I was able to successfully scrape and visualise the data on a 3D plane in Blender.
I concluded that this approach would be a viable method for both scraping and visualizing data, as it effectively combined the animation and data functionalities into a single workflow. With the technical setup in place, I began scraping the data I needed for the project and started experimenting with different ways to visualize it—focusing on making the output timely, dynamic, and visually engaging.
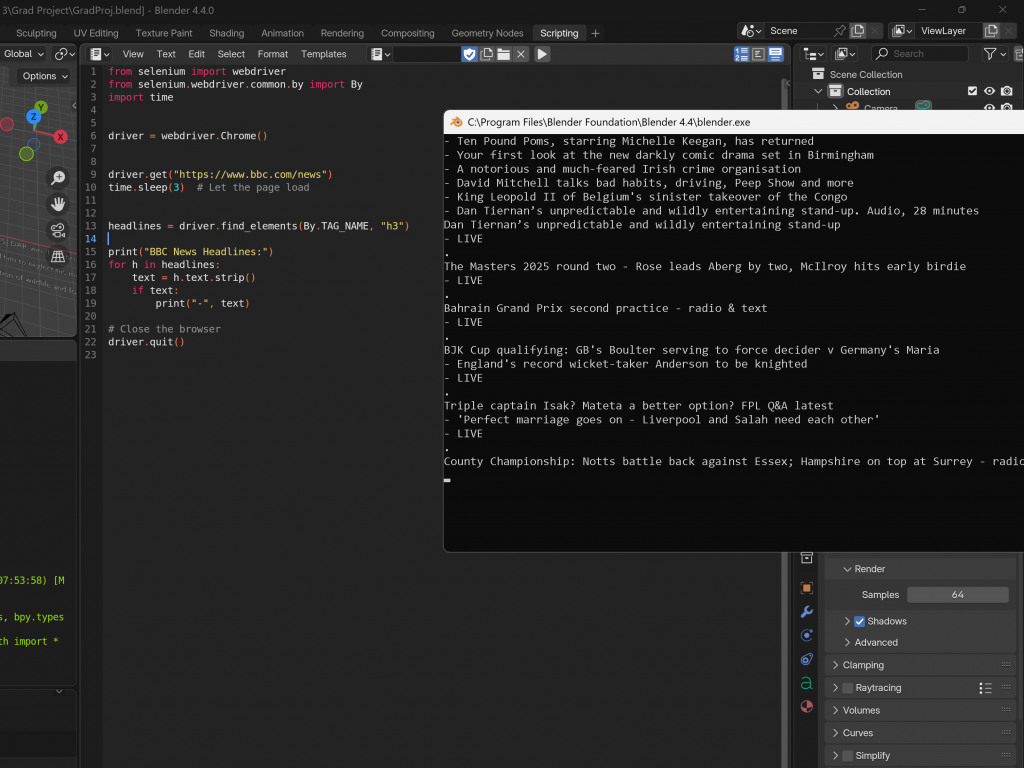
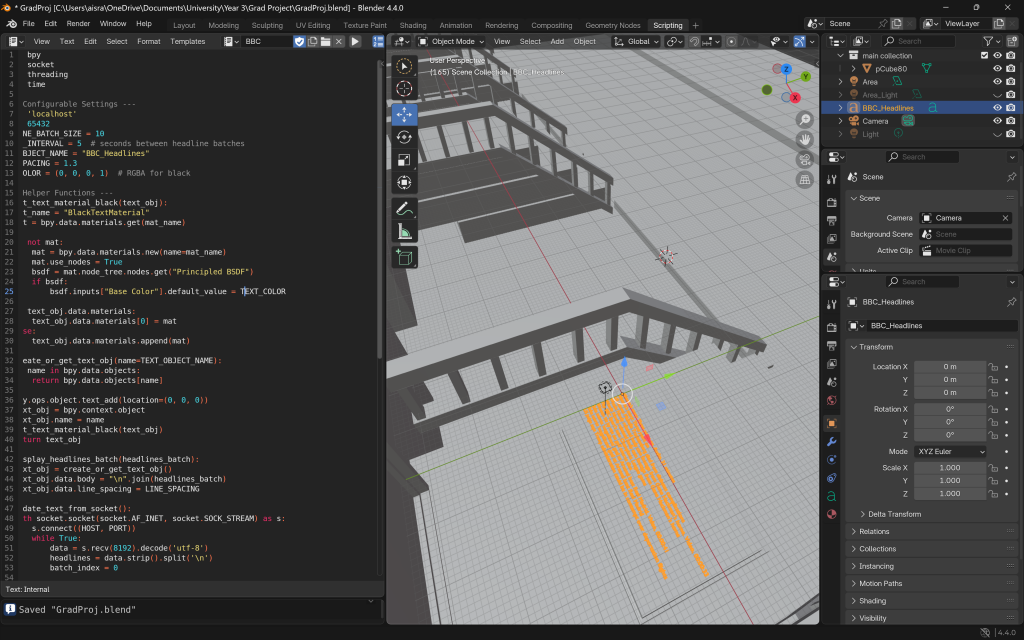
I began with headlines from the BBC homepage. While the initial scraping worked well, integrating live update functionality caused the software to crash repeatedly, highlighting the need for a more stable way to handle real-time data within Blender.
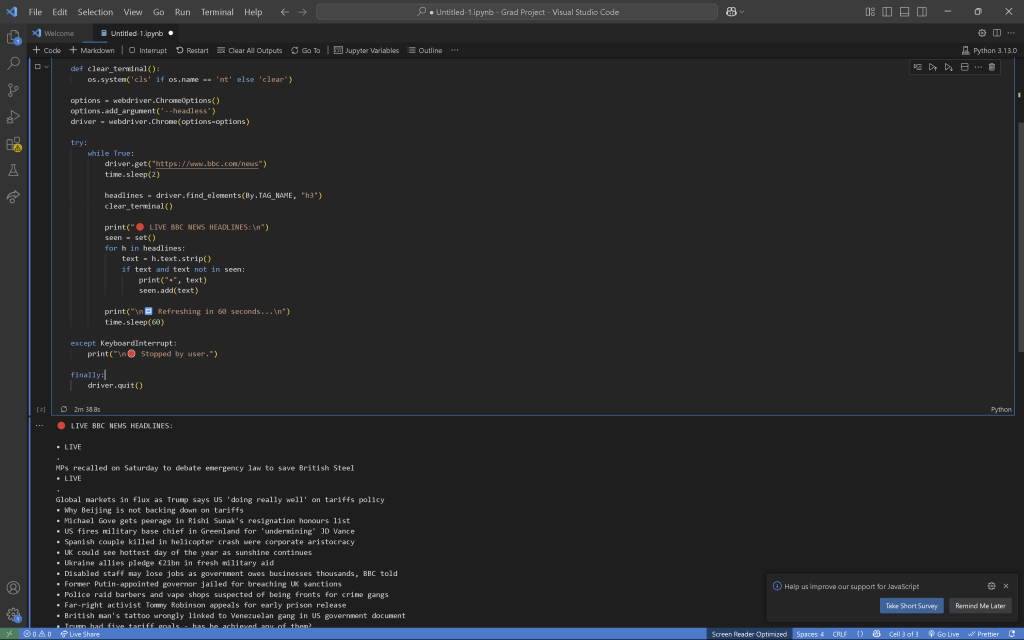
To troubleshoot further, I ran the code in isolated blocks using a Jupyter Notebook to identify anything that might be causing Blender to struggle. After fixing a few issues and confirming that the code worked as expected in VSCode, I integrated it back into Blender. However, when I ran it again, I encountered the same freezing issue, which suggested the problem wasn’t with the code itself, but rather with how Blender was handling it internally.
I realized the freezing was likely caused by running long operations directly on Blender’s main thread. Since Blender can’t perform any other tasks until the current operation completes—and in this case, that operation was continuous—it effectively locked up the entire application.
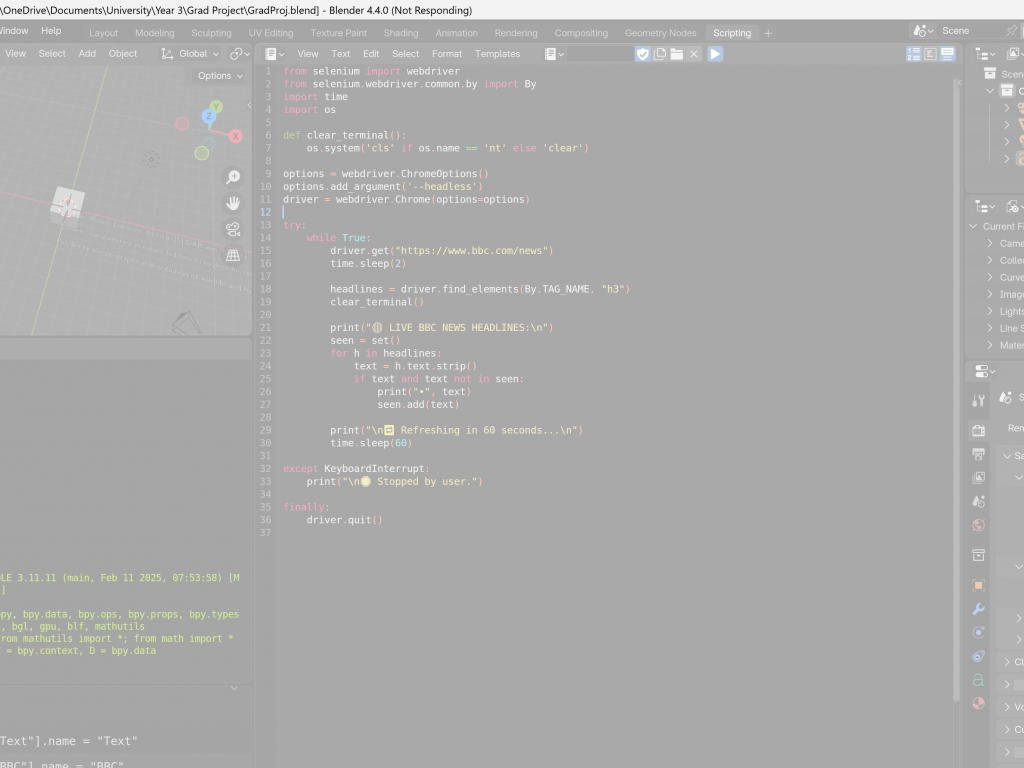
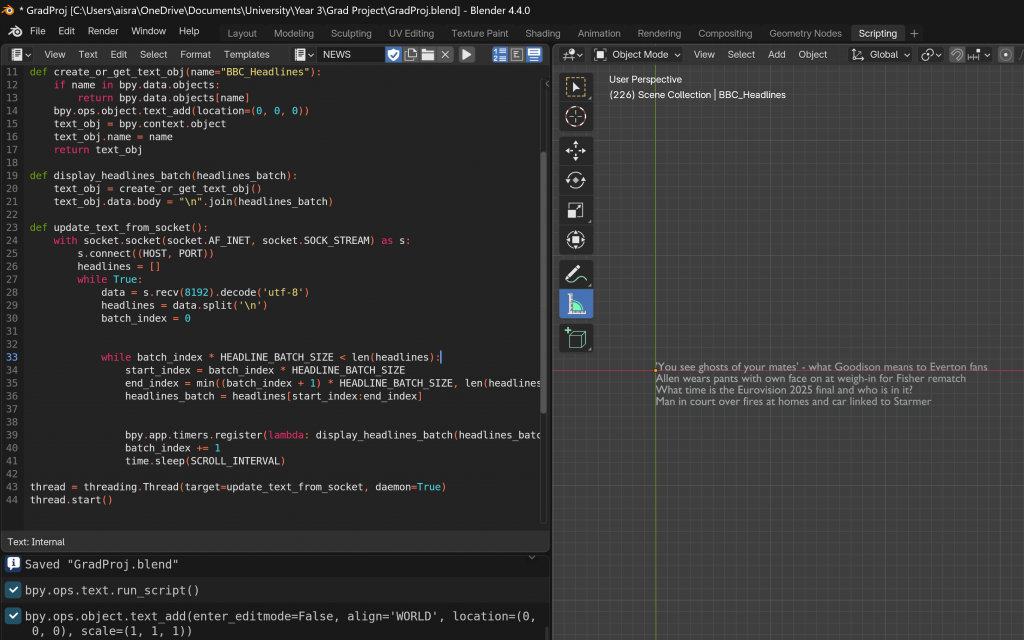
Eventually, I managed to get the live update functionality working alongside some basic visualisation. I used Selenium to scrape live BBC headlines every minute, and then updated a 3D text object in the Blender scene with the new data. To prevent Blender from freezing, I ran the update process asynchronously, allowing the headlines to refresh every 60 seconds without interrupting the animation or user interaction.
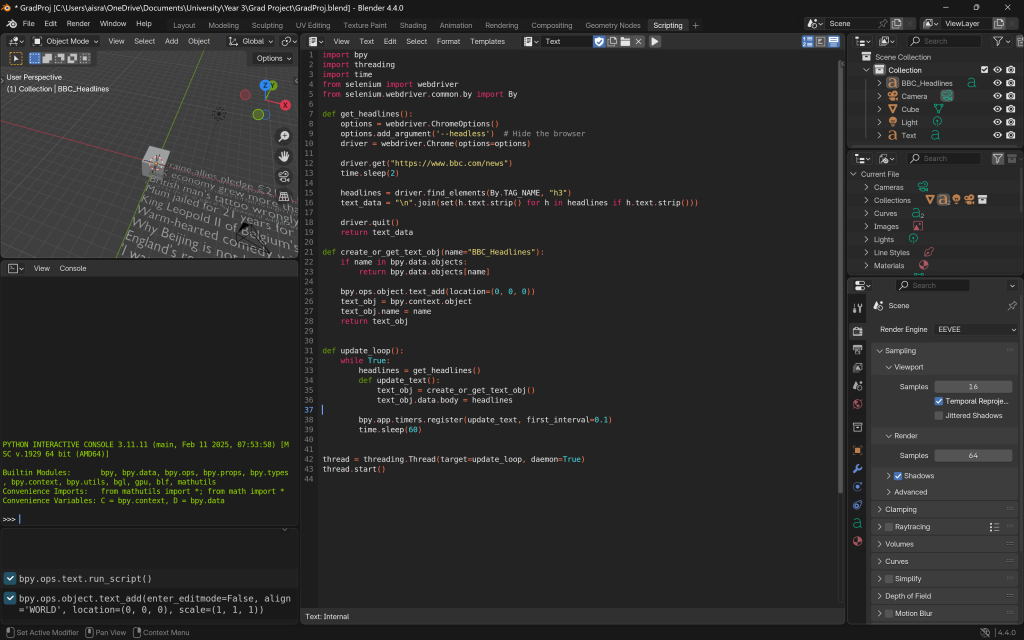
I then ran into an issue: although the data was refreshing, Blender would freeze every 60 seconds during the update. This clearly wasn’t viable, especially since the animation needed to loop smoothly without interruptions. To resolve this, I shifted to using sockets more deliberately—handling the dynamic scraping of data entirely outside Blender, while letting Blender focus solely on visualizing the incoming data and running the animation.
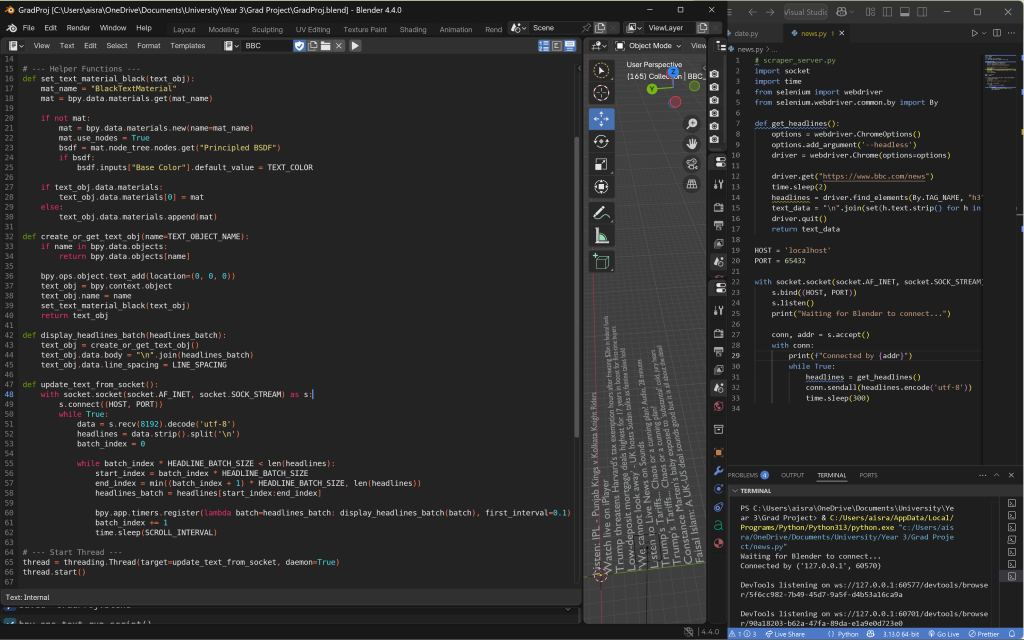
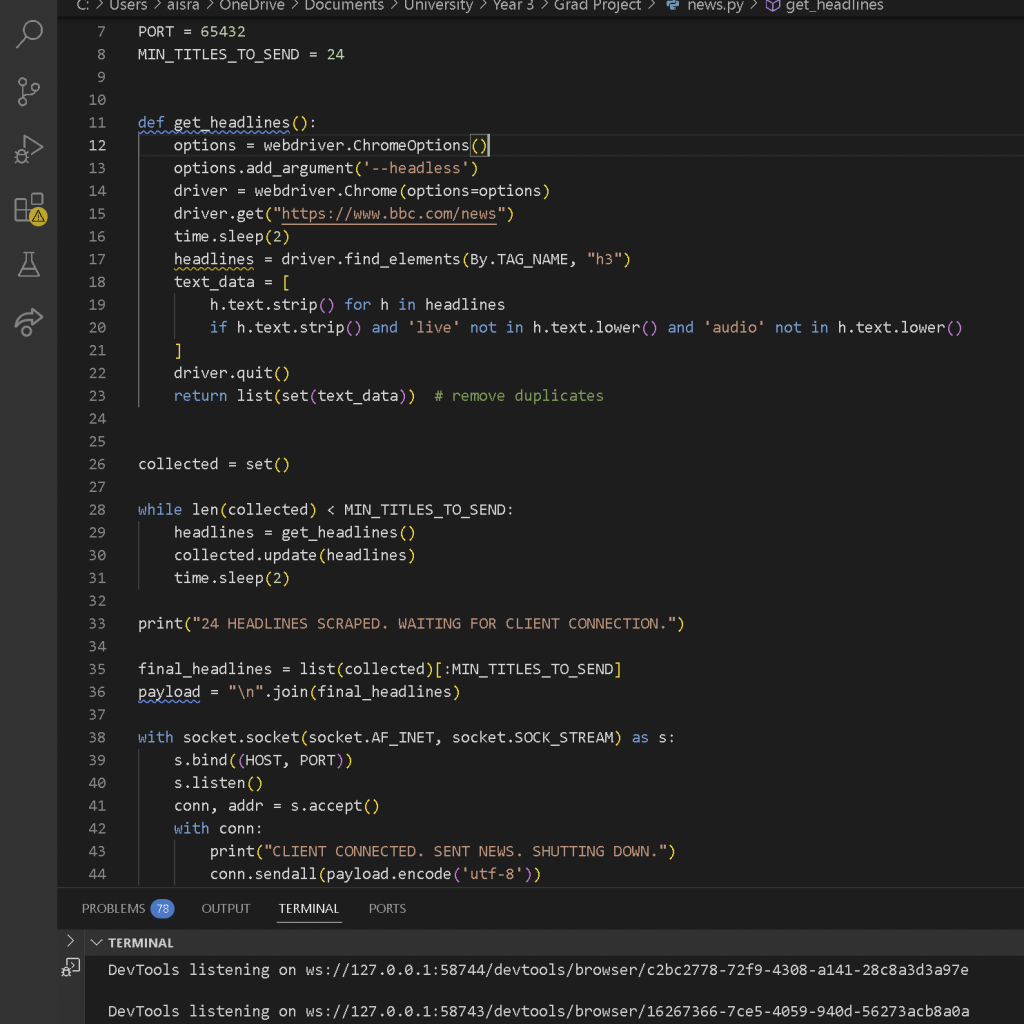
I coded the scraper in Visual Studio Code, and set up the client side in Blender to simply receive the data and render it visually. This separation worked much better—it ran smoothly, avoided crashes, and allowed for fast, dynamic updates without interrupting the animation flow.
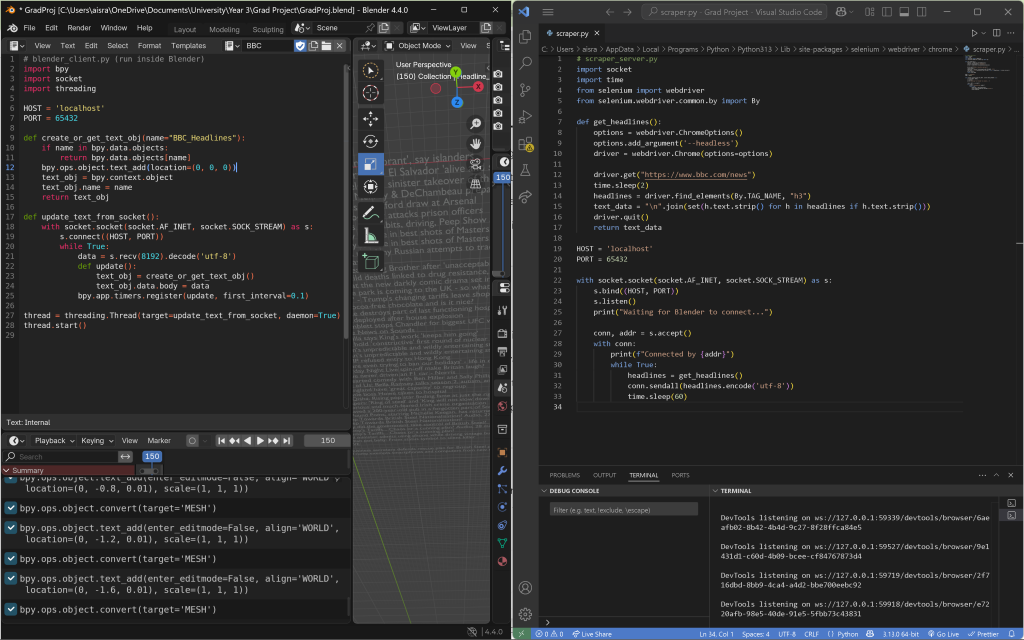
I ended up learning how sockets function—they enable real-time, two-way communication between a client (Blender) and a server (VSCode) by establishing a continuous TCP connection. This removes the need for repeated HTTP requests and responses, which I suspect was contributing to Blender crashing earlier. With sockets, data transfer and interaction became far more efficient.
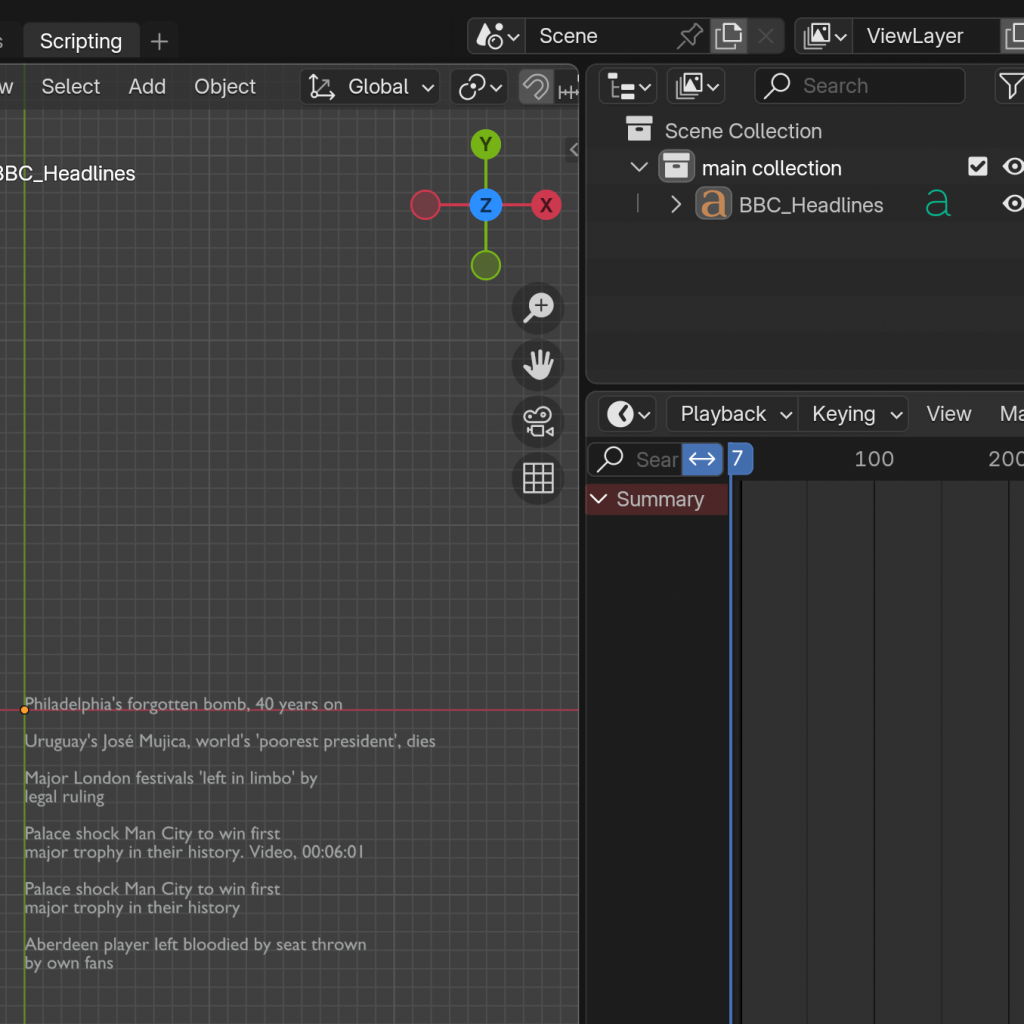
On the left, you can see the two processes finally communicating and successfully outputting text into Blender. To confirm that the data was still updating dynamically, I left a camera recording for a minute—and it was! The headlines were indeed changing in real time.
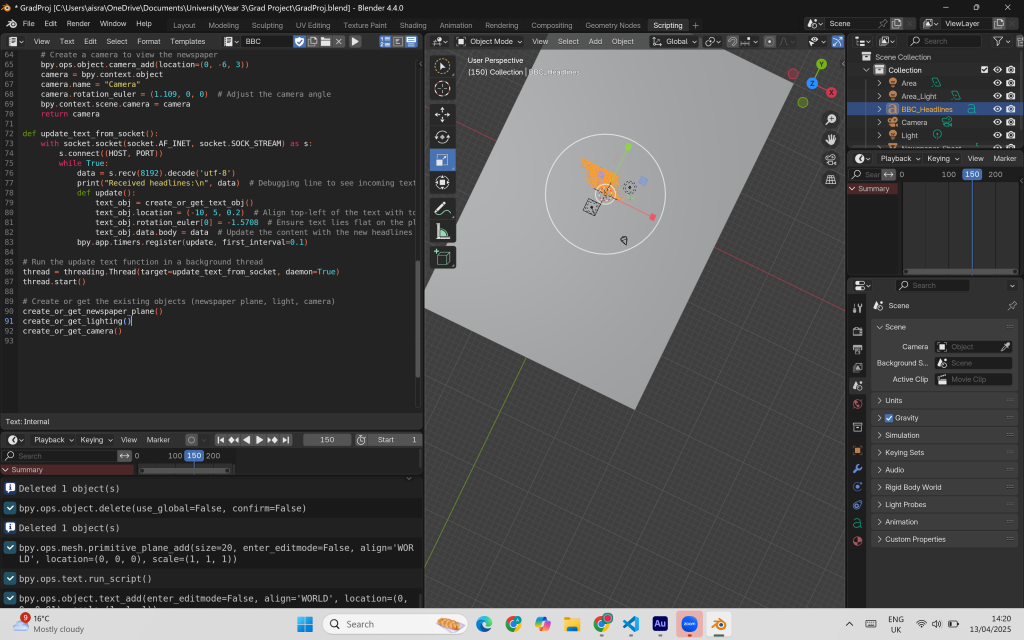
I also attempted to create a newspaper object onto which the data could be projected, with the intention of modeling a dynamically updating newspaper within the scene. However, this significantly slowed down the data loading process. It wasn’t viable—I couldn’t afford to have an empty frame in the animation while waiting for the newspaper to load. So, I chose a simpler and more stable solution: letting the text appear independently and building the animation around it, rather than binding it to a specific object.
The next thing I did was set the text colour to black. At first, I was confused because the change didn’t seem to take effect—but it turned out to be a simple issue with lighting. Once I checked the Shading tab, I realised the scene lighting was affecting how the colours appeared.
I also tried to add line spacing and implement a scroll function. However, this didn’t work as expected, so I decided to leave it for later. At this stage, it was more important that the data behaved the way I wanted; I could always focus on the aesthetics once the functionality was solid.
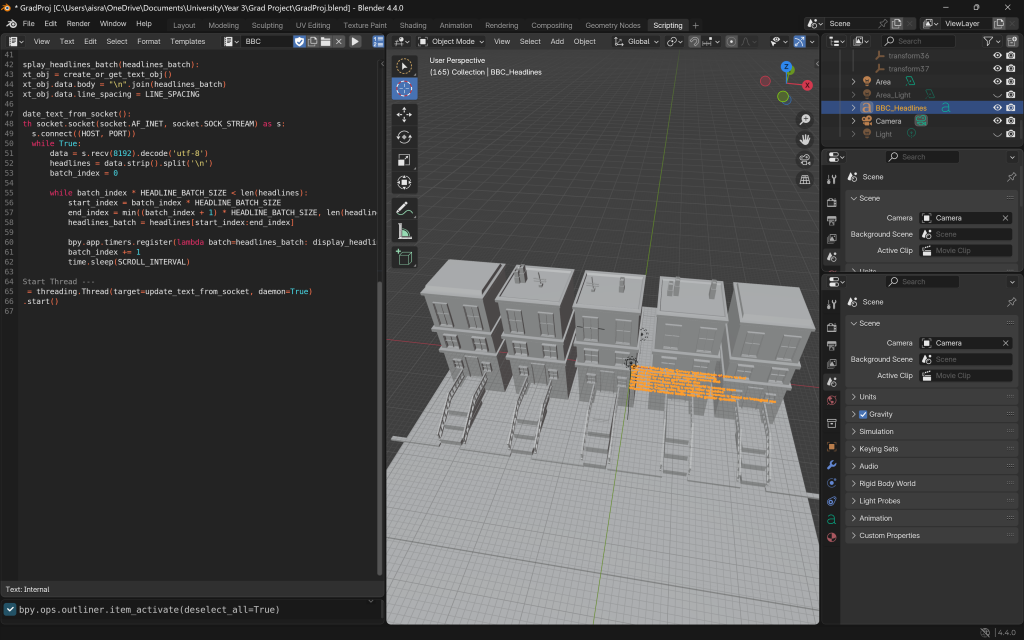
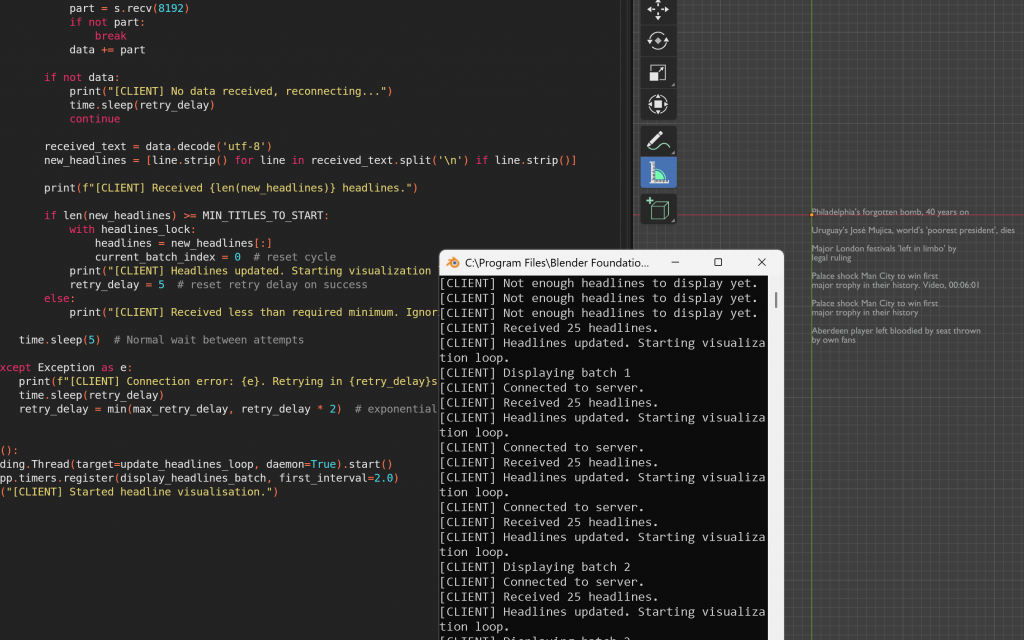
I then simplified the code to make it more manageable and added logic to scrape data every five minutes in a batch and visualise it going through this data. This approach was suggested by our supervisor, Ken, as a way to imply that the data is live without needing to stream headlines in literal real time, which often caused software and blocking issues. By collecting data at slightly longer intervals, we allow Blender the flexibility to visualize and interpret the headlines in a more intentional and stylized manner.
All the scraped headlines are sent to Blender, which then displays a few at a time, cycling through them in batches until all have been shown. This method keeps the visual experience dynamic and engaging—displaying everything at once would not only overwhelm the viewer, but also reduce the impact of individual headlines.
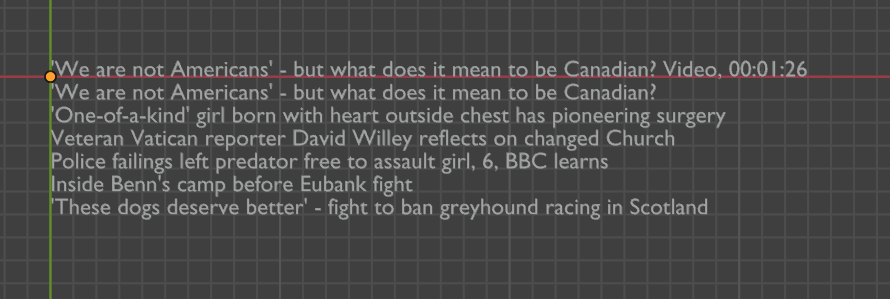
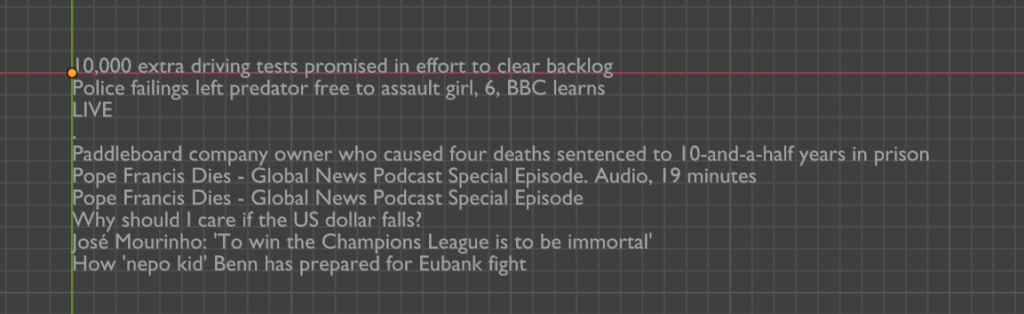
Next, I went through the data and realized I needed to filter out irrelevant content to ensure that only meaningful information would appear in the visualization. Since the data would be presented as part of a newspaper, elements like “Video, 00:01:26”, “LIVE”, or “Watch Now” were not useful in this context. Additionally, there were glitches in how each batch of data was appearing and disappearing from the screen.
I decided to do this later, and first work on getting it animated. In my head, the camera would be zoomed in on the newspaper, showing the headlines, then the character would walk in, look briefly at it, continue walking, and then turn the corner, while the batch of headlines which they saw would follow them. I first tried implementing this logic in Blender using some help from this playlist on YouTube, but there was the trouble of my animating using keyframes. While this allowed more flexibility, I was unable to allow the logic of scrolling apply to every batch, and it would only work if I applied this animation to every batch that would come. This was not viable so I decided to do it via the script. While this is less visually appealing, it suited my purpose, as it was repeatable, and I could apply it where I wanted without manual hassle.
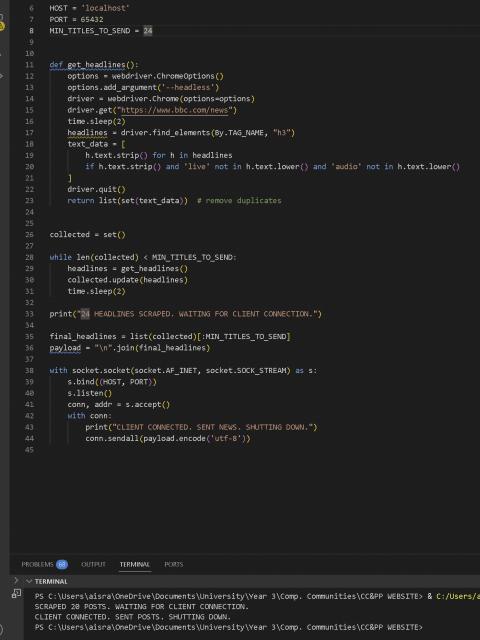
I then focused on filtering out unnecessary headlines — particularly those that wouldn’t make sense in a printed newspaper format, such as ones containing terms like ‘video’, ‘live’, or ‘audio’. This process took longer than expected because it involved dealing with an unpredictable variable: I couldn’t always anticipate which headlines would include elements that didn’t translate well to print. Aside from the obvious keywords, there were occasionally unexpected phrases, so I chose to filter based on the most common terms I repeatedly noticed.
Then, I did some more work on potential spacing. I encountered the problem of it lagging and glitching, and added some prints to see what was going on. Because it was being scraped and visualised live, there were performance issues, issues with the handling not being done properly as either side was waiting either for a non existent connection as it has shut down or checking too much for new data as opposed to how often data is actually being sent. I spent a good deal of time cleaning up this logic and making sure it was in place.
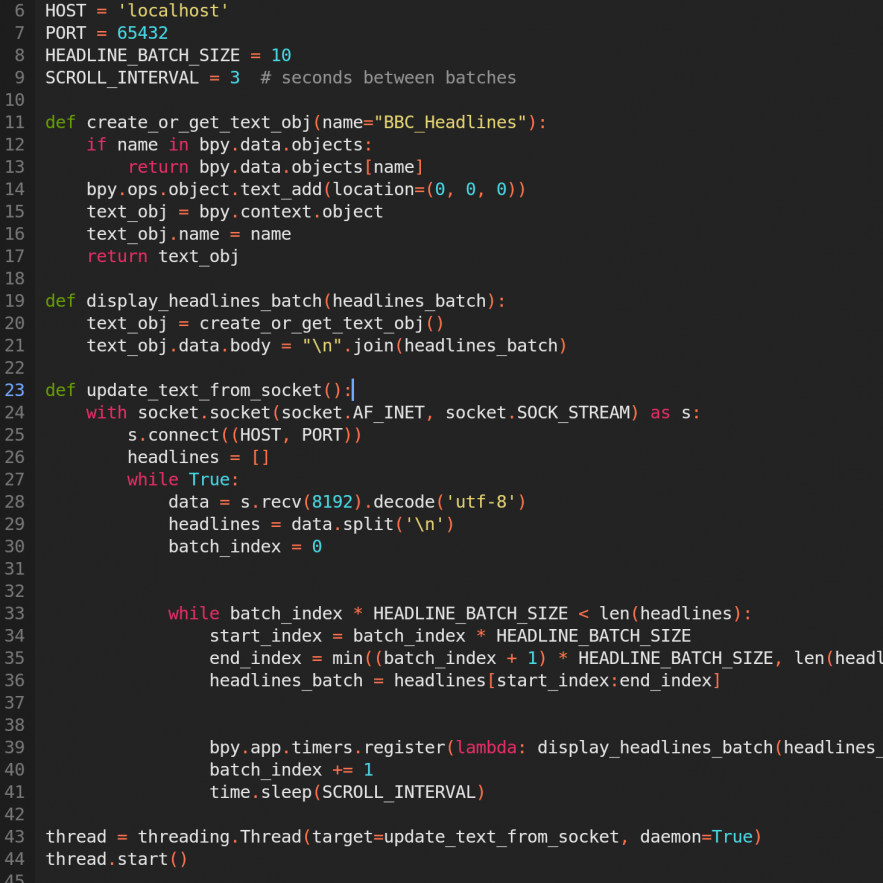
I was able to deal with some of the glitching by, instead of having an object created for every headline, which is what it was previously doing, just create one object which was appended to and added to as appropriate. This was easier to handle, especially when all the data scraping and visualising would be combined into one respective file each.
As I was doing this, I realised that real-time scraping was not viable for my workflow. While making it as one object was slightly better, the issues were primarily to do with how intensive it was for real time data to be streamed. I began working on a simplified and modified version of the code, where the scraping would occur as soon as the script was run, and the headlines would be sent to Blender once a connection was established. This was a shift from the previous approach, where scraping only began after Blender had connected — a setup that made it difficult to control the timing of data delivery and visualisation.
While this approach was no longer truly “live”, it was a necessary compromise. As mentioned earlier, streaming real-time data introduced several issues: it caused lags, was unreliable, and once I started animating the live content, the instability of the stream became a serious problem. Because the data was arriving in real-time, I had very limited control over the exact timing — and that timing was essential to ensure that the animation and the corresponding data visuals remained properly synchronised.
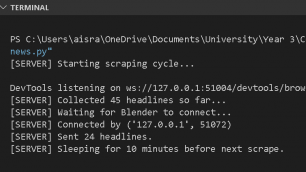
I ended up making it so that it would scrape upon run and send to the client once it was connected, and then sleep before the next scrape.
As time went on and I was working on animating the live-streamed news headlines, I began to realise that there were certain aspects of the project that wouldn’t be viable to complete within the timeframe. One major challenge was the looped nature of the animation — the idea of scraping data every 10 minutes, sending new updates to Blender, and having Blender continuously listen and update the visuals accordingly. While I managed to get this working on the code level, I wasn’t confident in how to loop the animation and synchronise it precisely with the incoming data.
Additionally, I had six other sources to scrape from — each with different types of data, timings, and required visual treatments. This made the logic of looping even more complex: not only did I need to cycle through the visualisations, but I also had to make sure that new data arrived at the right time, was updated in Blender, and that all of this was in sync with the animation timeline.
In theory, it was achievable, but in practice, the scraping and visualising were far less straightforward than I had anticipated. On top of this, streaming real-time data caused performance issues — there were lags, and once I started animating the live content, the unreliability of the stream became a problem. Since the data was being received in real-time, controlling the timing became very difficult, and this precise timing was crucial to making sure the scenes in the animation and the different data stream remained aligned.
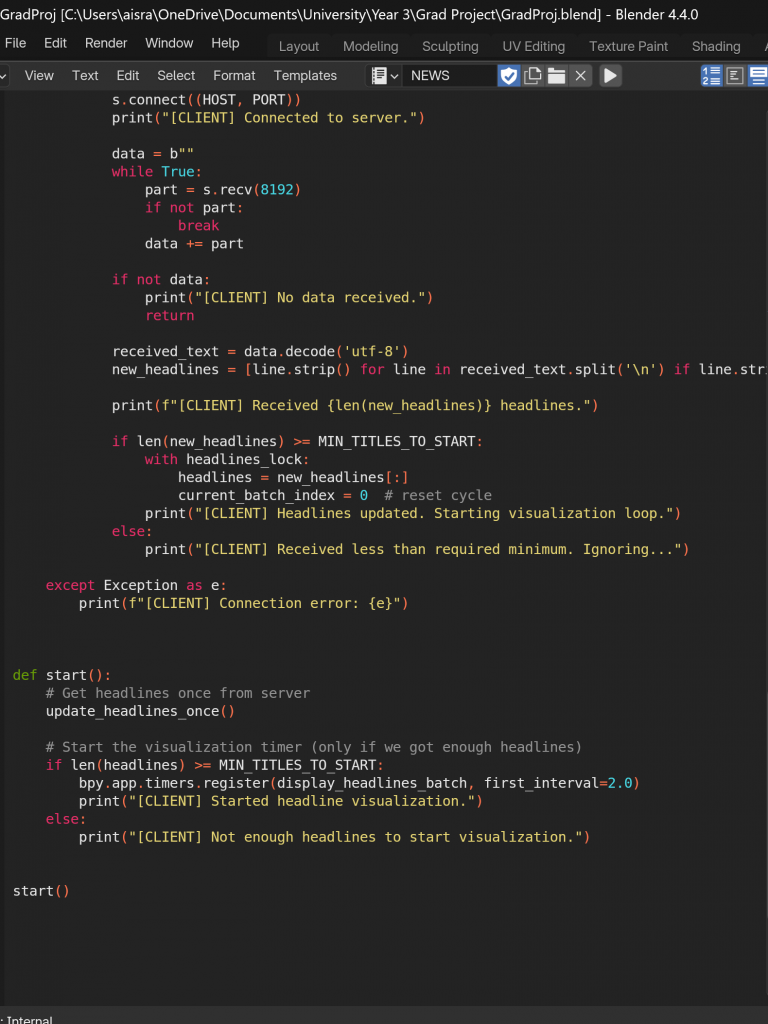
Thus, for the sake of the submission and with the intent of improving the loop for the exhibition, I decided to remove the looping through the batches of headlines until new is received and the continuous socket listening, receiving and updating functionality. I added the logic for it to only print once adequate posts have been scraped after running and when it is waiting for the client connection, and for when it connects, it sends the data and shuts the server. I then also tweaked the headlines animation logic so it was a bit better, so that it would show a total of 4 batches of 6 headlines, and the first batch would stay longer and somehow scroll up, following the character, while the other batches stayed static and switched through each one.
I not only implemented this here, but in every other data scraped as well, to ensure consistency and continuity in my process.