I first attempted to scrape Twitter, as I remembered it having a fairly straightforward method a few years ago. However, with its transition to X, scraping has become significantly more difficult due to increased restrictions and changes in platform architecture. After spending some time trying, I was advised to explore Mastodon instead—a decentralized, open-source social networking platform that offers a microblogging experience similar to Twitter, and which many users migrated to after disagreeing with Twitter’s policies.
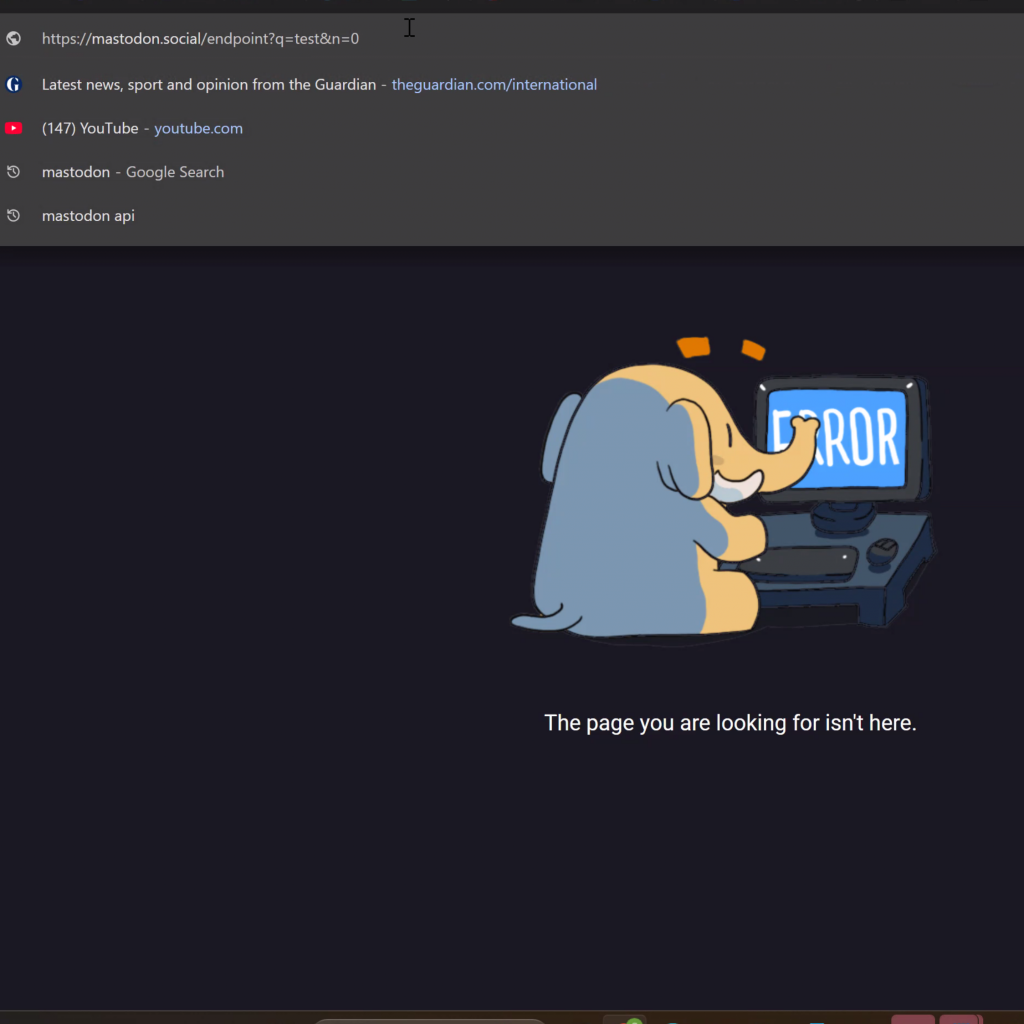

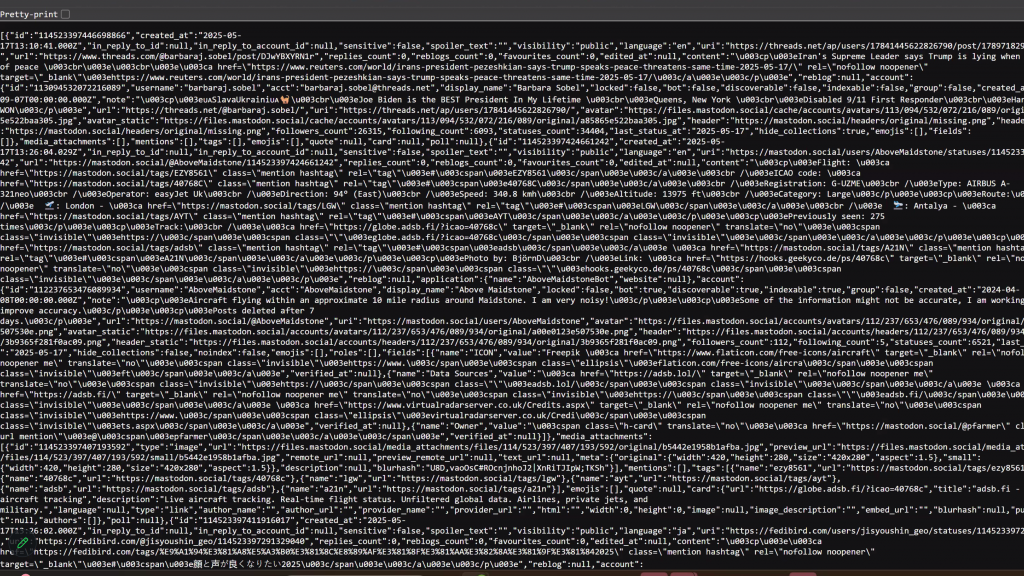
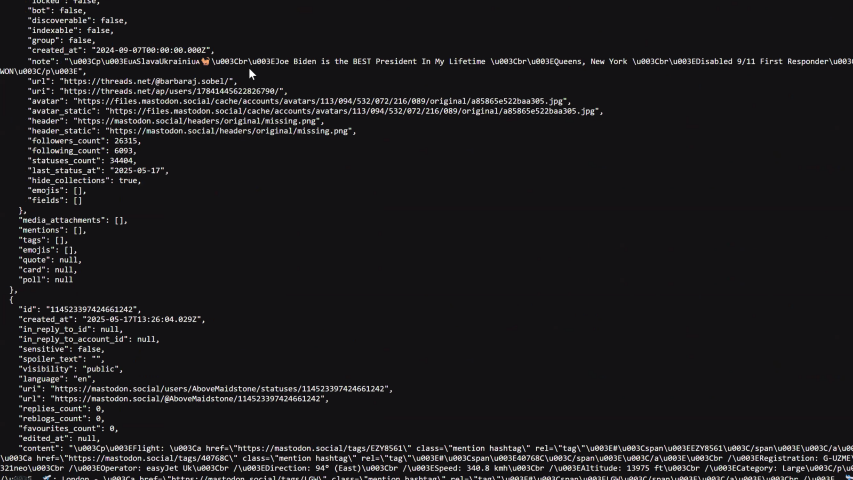
I began by exploring the Mastodon API, attempting to identify relevant endpoints and make some basic queries. Initially, I faced several issues—using incorrect parameters, hitting the wrong endpoints, and generally stumbling through the unfamiliar documentation. However, after some trial and error, I eventually gained clarity and managed to access a wealth of information: publicly available posts, complete with timestamps and other useful metadata.
I then formatted the data using pretty print, which made it much easier to view and navigate—clearly showing each post and its associated metadata. One issue I noticed was the presence of posts in many different languages, which posed a problem conceptually: the character in my animation wouldn’t be able to subconsciously absorb and be affected by information they can’t understand. However, given the constraints on my time, I decided to postpone solving this and prioritise completing the scraping and visualisation components before my submission deadline.
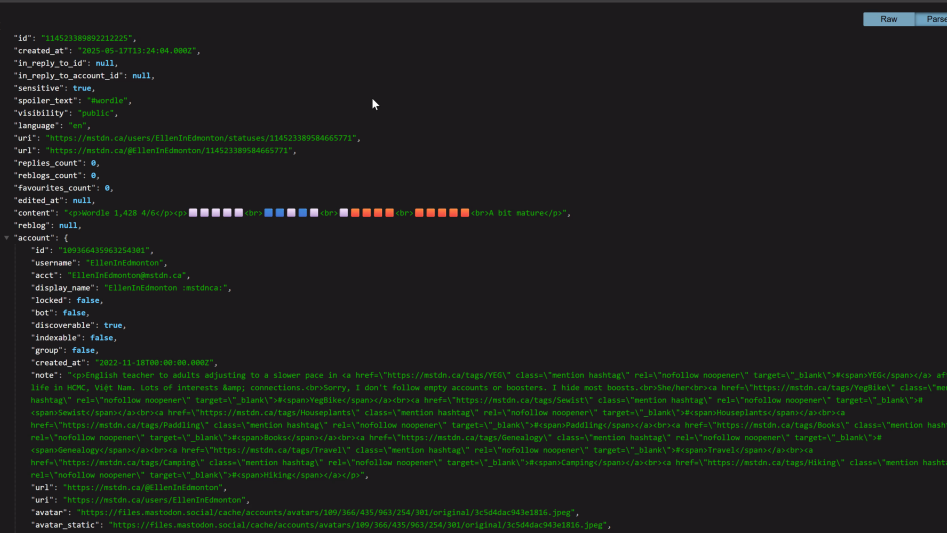
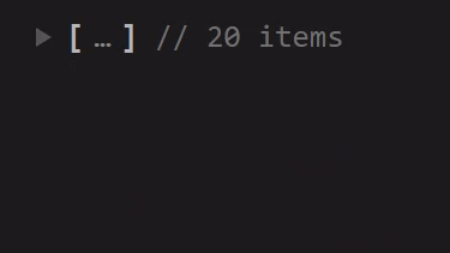
According to the API documentation, there was a limit of 20 results per request, so I included limit=20 in my query to ensure I was staying within the specified boundaries. This gave me a manageable batch of posts to work with and allowed for quicker iteration during the visualisation process.
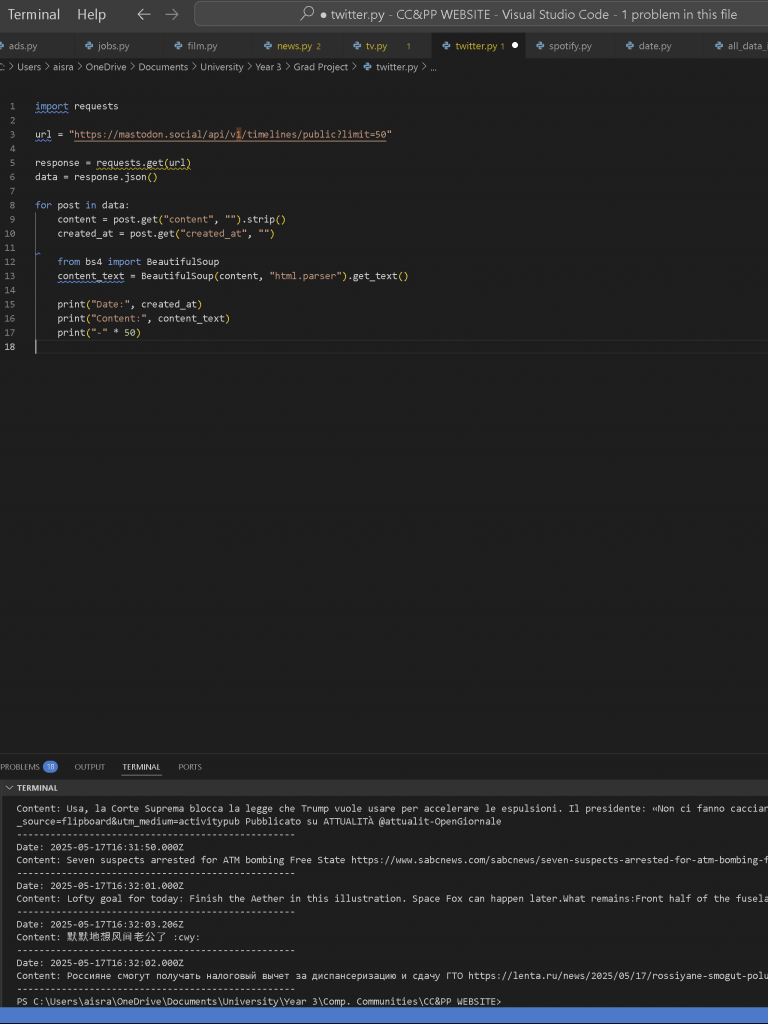
So I began scraping, and the process turned out to be quite straightforward since the content was rendered as static HTML. One interesting thing I noticed was that while each refresh displayed the latest 20 posts, their order wasn’t strictly chronological. The timestamps varied by milliseconds, but they didn’t appear to follow a clear oldest-to-newest or newest-to-oldest sequence. I assumed the sorting probably operated at the level of seconds rather than milliseconds, which explained the slight inconsistency. While I thought it would be nice for the posts themselves to show in order in the visualisation, this was not totally imperative for now.
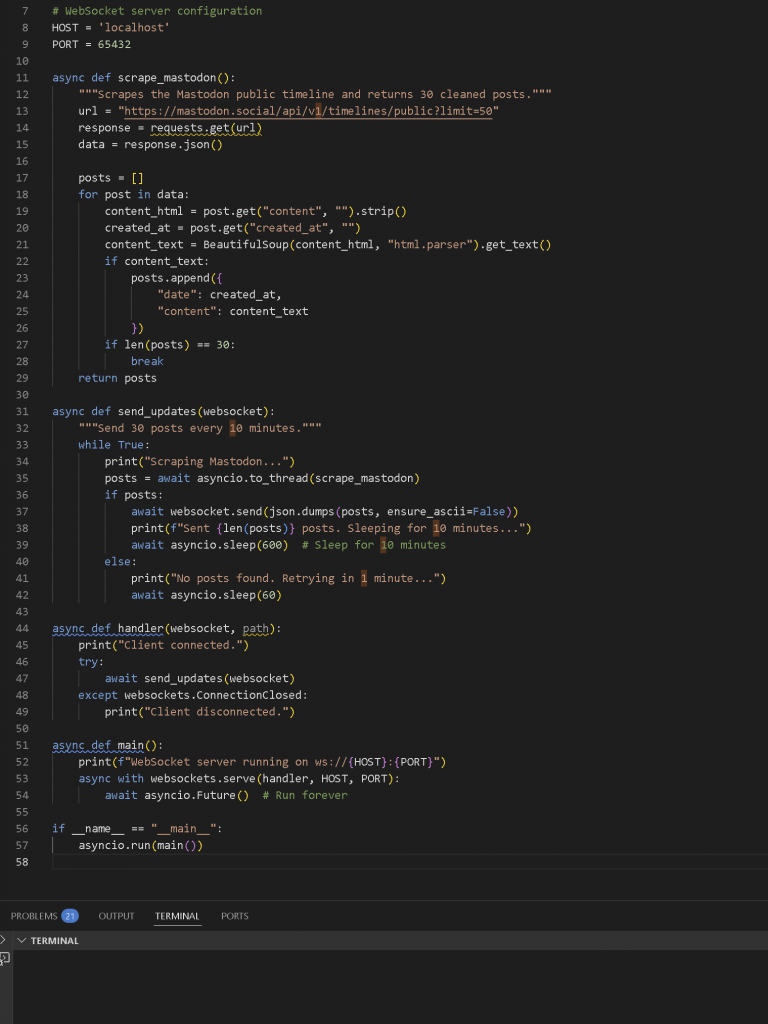
I then converted it into a socket server-side script that would run continuously, refreshing and scraping new data every 10 minutes. I also added some basic logic and exception handling to help quickly debug any issues that came up during the scraping or transmission process.
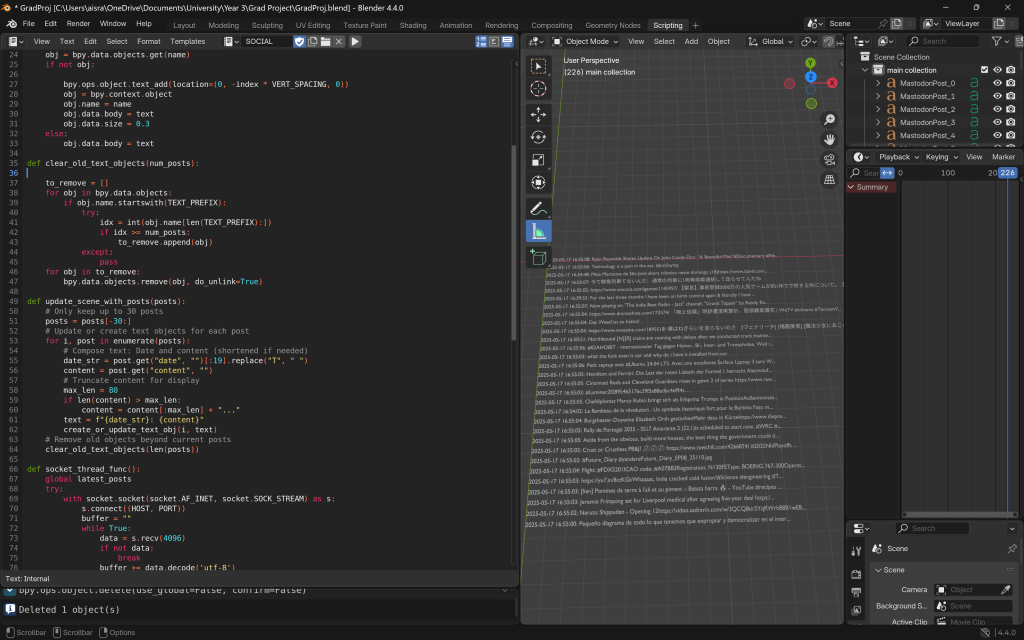
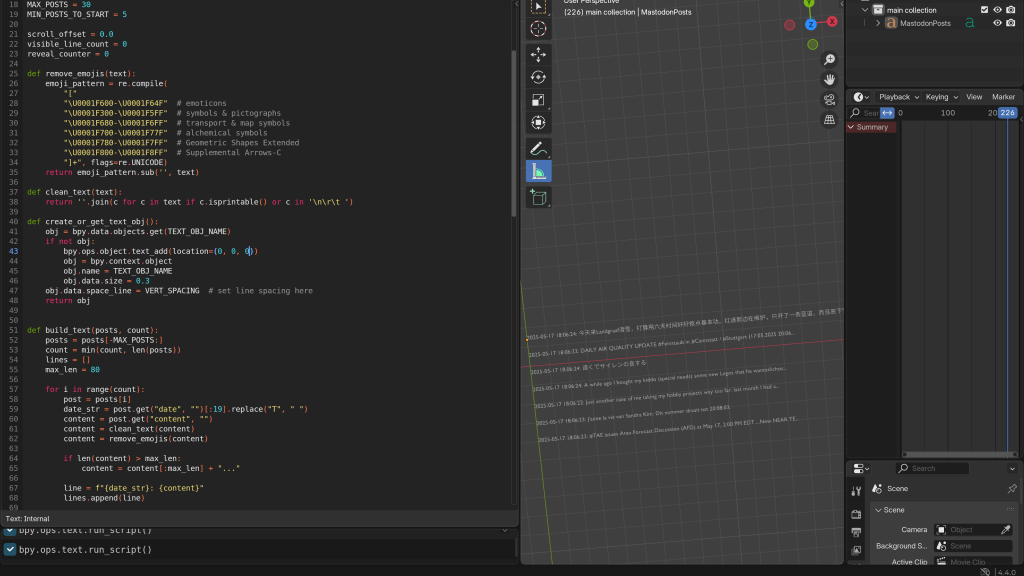
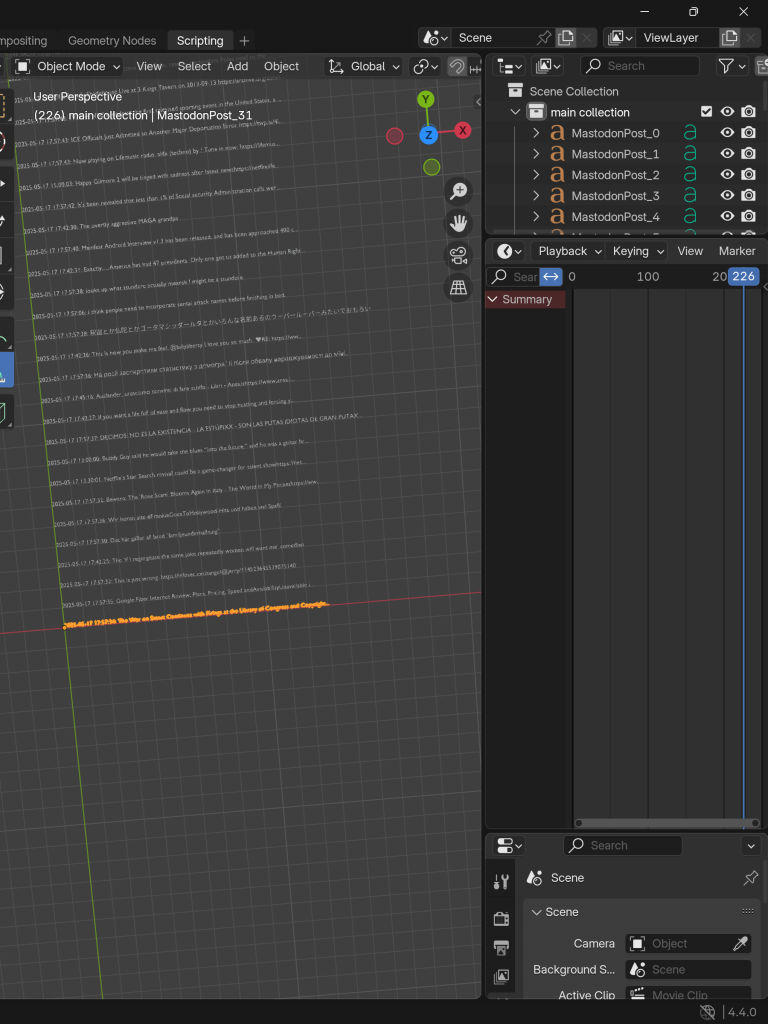
I made sure to add a scrolling functionality, where one by one a post would append vertically down to the previous, and scroll up. I was just experimenting here to see what functionalities were viable for me to do.
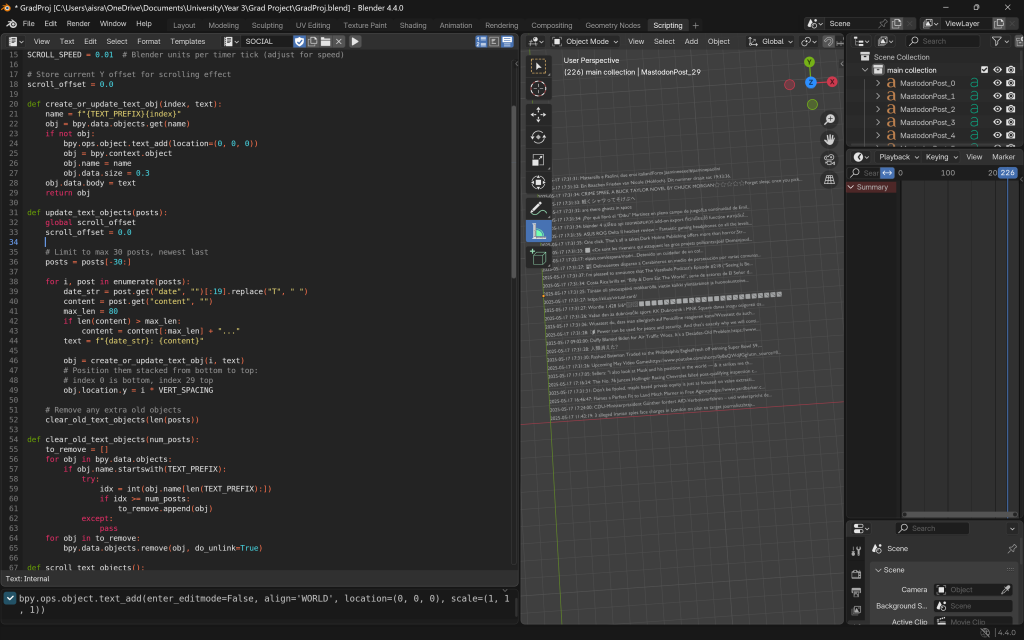
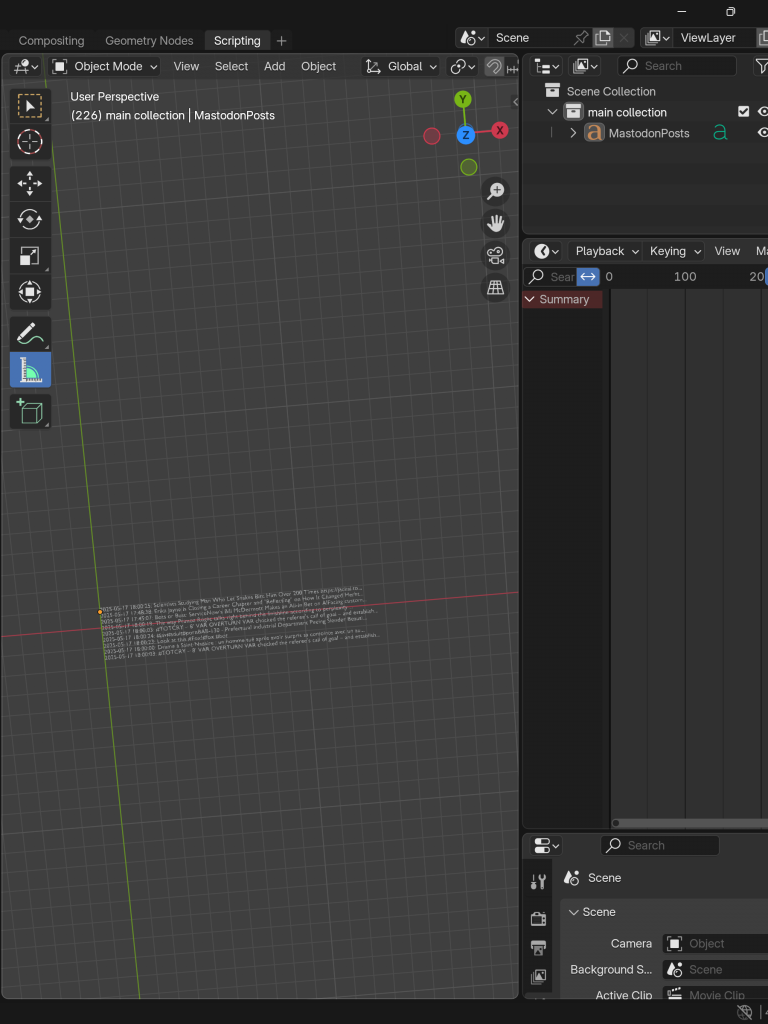
I then played around with more things like spacing. I even tried to add new fonts at this point but this was too difficult. I ended up making it all one object to which a new post keeps being appended, and made sure the date was in a human readable format, which it wasn’t in the HTML.
At this point, I also removed the continuous scraping and updating functionality from both the server and client side script, for the reasons mentioned in the previous data scraping page entries.
I made sure to remove any emojis due to a utf-8 error I was getting, and then, I was done with the basic visualisation.